This article will give a breakdown of the information contained in the Performance Stats report, which shows the key performance indicators for your business.
Where to find this Report
This report can be found under Manager > Reports > Additional Reports > Financial
Click a section below to expand for more details 👇
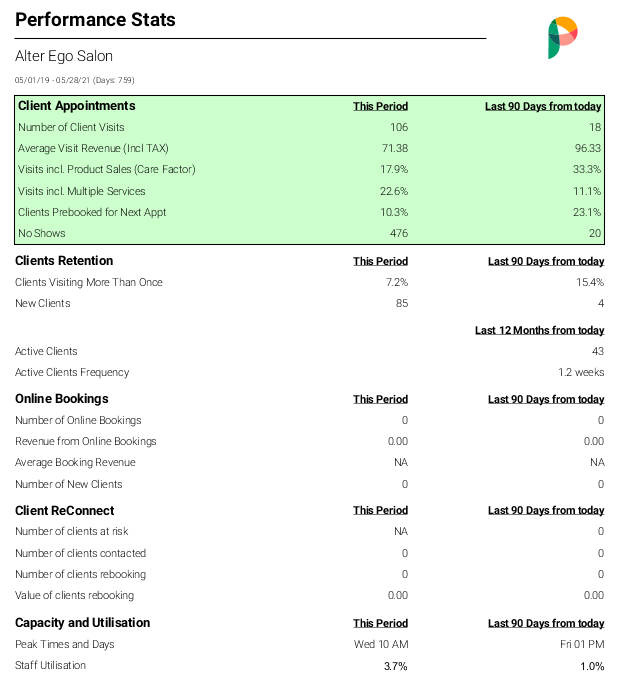
Number of Client Visits
Shows the number of unique client visits per day. A visit is counted once a client pays for a service and/or a product.
Multiple sales for one client on the same day will only be counted as one visit. However, if you are running the report over a date range, and the same client visits multiple days over those dates, then one visit will be counted for each day (e.g. a visit on Monday and Tuesday will be counted as 2 visits).
Average Visit Revenue
Shows the average amount of money your clients spend per visit to your business
Visits Incl. Product Sales(Care Factor)
Shows the % of visits that include product sales
Visits Incl. Multiple Services
Shows the % of client treatments booked that had more than one service in the booking
Clients Prebooked For Next Appt
Shows the % of clients that book another appointment before they leave the salon
No Shows
Shows the number of appointments that have not been performed due to the client failing to show
Clients Visiting More Than Once
Shows the % of clients that visited during the displayed period of time who have had a second visit during the same period of time.
New Clients
Shows the number of new clients that visited during the periods of time displayed
Active clients
Shows the number of clients that are already clients in your system that made visits to the business within the last 12 months from the date that the report is generated
Active Client Frequency
Shows the frequency of how often the client returns to the salon for their next appointment on average within the last 12 months from the date that the report is generated
Number of Online Bookings
Shows the number of appointments that were made through the online booking widget during the periods of time displayed
Revenue from Online bookings
Shows the revenue generated for online bookings during the periods of time selected
Average Booking revenue
Shows the average revenue generated from your online bookings during the periods of time selected
Number of New Clients
The number of new clients that booked an appointment online with your business during the periods of time selected
Number of clients at risk
Shows the number of clients who have had three or more visits for a service category but have not been back to have a service from that category for two weeks
Number of clients contacted
Shows the number of clients who have been sent an SMS/email through the client reconnect system
Number of clients rebooking
Shows the number of clients who have booked an appointment after receiving the client reconnect message
Value of clients rebooking
Shows the revenue generated from clients who have booked an appointment after receiving the client reconnect message.
Peak times and Days
Shows the Hours and the day of the week where the business generates the most revenue. This is based on the sales that were put through in that period of time
Staff Utilisation
Shows the percentage of time all your staff members were booked out during the period of time selected, the % rate goes against the full schedule during this period of time which is viewed as 100%